This post contains some sample PySpark scripts. During my “Spark with Python” presentation, I said I would share example codes (with detailed explanations). I posted them separately earlier but decided to put them together in one post.
Grouping Data From CSV File (Using RDDs)
For this sample code, I use the u.user file of MovieLens 100K Dataset. I renamed it as “users.csv”, but you can use it with the current name if you want.
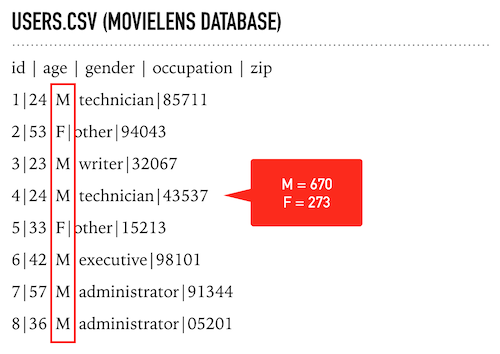
Using this simple data, I will group users based on gender and find the number of men and women in the users data. As you can see, the 3rd element indicates the gender of a user, and the columns are separated with a pipe symbol instead of a comma. So I write the below script:
Here is the step-by-step explanation of the above script:
- Line 1) Each Spark application needs a Spark Context object to access Spark APIs. So we start with importing the SparkContext library.
- Line 3) Then I create a Spark Context object (as “sc”). If you run this code in a PySpark client or a notebook such as Zeppelin, you should ignore the first two steps (importing SparkContext and creating sc object) because SparkContext is already defined. You should also skip the last line because you don’t need to stop the Spark context.
- Line 5) sc.TextFile method reads from a file and returns the content as RDD (when we call an action because RDDs have lazy evaluation). The print command will write out the result.
- Line 6) I use “map” to apply a function to all rows of RDD. Instead of defining a regular function, I use the “lambda” function. The lambda functions have no name and are defined inline where they are used. My function accepts a string parameter (called X), parses the X string to a list, and returns the combination of the 3rd element of the list with “1”. So we get Key-Value pairs like (‘M’,1) and (‘F’,1). By the way, the index of the first element is 0.
- Line 7) reduceByKey method is used to aggregate each key using the given reduce function. The previous “map” function produced an RDD which contains (‘M’,1) and (‘F’,1) elements. So the reduceByKey will group ‘M’ and ‘F’ keys, and the lambda function will add these 1’s to find the number of elements in each group. The result will be a Python list object: [(u’M’, 670), (u’F’, 273)]
- Line 8) Collect is an action to retrieve all returned rows (as a list), so Spark will process all RDD transformations and calculate the result.
- Line 10) sc.stop will stop the context – as I said, it’s not necessary for PySpark client or notebooks such as Zeppelin.
If you’re not familiar with the lambda functions, let me share the same script with regular functions:
It produces the same result with the same performance. Now let me write another one. This time, I will group the users based on their occupations:
Here is the step-by-step explanation of the above script:
- Lines 1,3,14) I already explained them in the previous code block.
- Line 5) Instead of writing the output directly, I will store the result of the RDD in a variable called “result”. sc.textFile opens the text file and returns an RDD.
- Line 6) I parse the columns and get the occupation information (4th column)
- Line 7) I filter out the users whose occupation information is “other”
- Line 8) Calculating the counts of each group
- Line 9) I sort the data based on “counts” (x[0] holds the occupation info, x[1] contains the counts) and retrieve the result.
- Lined 11) Instead of print, I use “for loop” so the output of the result looks better.
Grouping Data From CSV File (Using Dataframes)
This time, I will use DataFrames instead of RDDs. DataFrames are distributed data collections organized into named columns (in a structured way). They are similar to tables in relational databases. They also provide a domain-specific language API to manipulate your distributed data, so it’s easier to use.
The Spark SQL module provides DataFrames, which are primarily used as API for Spark’s Machine Learning lib and structured streaming modules. Spark developers recommend using DataFrames instead of RDDs because the Catalyst (Spark Optimizer) will optimize your execution plan and generate better code to process the data.
I will use the “u.user” file of MovieLens 100K Dataset again. I will find the total number of men and women in the users data. I recommend you compare these codes with the previous ones (in which I used RDDs) to see the difference.
Here is the step-by-step explanation of the above script:
- Lines 1-5,12) I already explained them in previous code blocks.
- Line 7) I use DataFrameReader object of spark (spark.read) to load CSV data. As you can see, I don’t need to write a mapper to parse the CSV file.
- Line 8) If the CSV file has headers, DataFrameReader can use them, but our sample CSV has no headers, so I give the column names.
- Line 9) Instead of reduceByKey, I use the groupby method to group the data.
- Line 10) I calculate the counts, add them to the grouped data, and show the method prints the output.
What if we want to group the users based on their occupations?
Here is the step-by-step explanation of the above script:
- Lines 1-5,14) I already explained them in previous code blocks.
- Line 7) I use DataFrameReader object of spark (spark.read) to load CSV data. As you can see, I don’t need to write a mapper to parse the CSV file.
- Line 8) If the CSV file has headers, DataFrameReader can use them, but our sample CSV has no headers, so I give the column names.
- Line 9) “Where” is an alias for the filter (but it sounds more SQL-ish. Therefore, I use it). I use the “where” method to select the rows whose occupation is not others.
- Line 10) I group the users based on occupation.
- Line 11) Count them, and sort the output ascending based on counts.
- Line 12) I use the show to print the result
Please compare these scripts with RDD versions. You’ll see that using DataFrames is more straightforward, especially when analyzing data.
Spark SQL Module
Spark SQL Module provides DataFrames (and DataSets – but Python doesn’t support DataSets because it’s a dynamically typed language) to work with structured data. First, let’s start creating a temporary table from a CSV file and run a query on it. I will use the “u.user” file of MovieLens 100K Data (I save it as users.csv).
Here is the step-by-step explanation of the above script:
- Lines 1-5,13) I already explained them in previous code blocks.
- Line 7) I use DataFrameReader object of spark (spark.read) to load CSV data. As you can see, I don’t need to write a mapper to parse the CSV file.
- Line 8) If the CSV file has headers, DataFrameReader can use them, but our sample CSV has no headers, so I give the column names.
- Line 9) Using the “createOrReplaceTempView” method, I register my data as a temporary view.
- Line 11) I run SQL to query my temporary view using Spark Sessions sql method. The result is a DataFrame, so I can use the show method to print the result.
When I check the tables with “show tables”, I see that the “users” table is temporary, so when our session(job) is done, the table will be gone. What if we want to store our data as persistent? If our Spark environment is configured to connect Hive, we can use the DataFrameWriter object’s “saveAsTable” method. We can also save the file as a parquet table, CSV file, or JSON file.
Here is the step-by-step explanation of the above script:
- Lines 1-5,21) I already explained them in previous code blocks.
- Line 7) I use DataFrameReader object of spark (spark.read) to load CSV data. The result will be stored in df (a DataFrame object)
- Line 8) If the CSV file has headers, DataFrameReader can use them, but our sample CSV has no headers, so I give the column names.
- Line 10) I use the saveAsTable method of DataFrameWriter (write property of a DataFrame) to save the data directly to Hive. The “mode” parameter lets me overwrite the table if it already exists.
- Line 12) I save data as JSON files in the “users_json” directory.
- Line 14) I save data as JSON parquet in the “users_parquet” directory.
- Line 16) I save data as CSV files in the “users_csv” directory.
- Line 18) Spark SQL’s direct read capabilities are incredible. You can directly run SQL queries on supported files (JSON, CSV, parquet). Because I selected a JSON file for my example, I did not need to name the columns. The column names are automatically generated from JSON files.
Spark SQL module also enables you to access various data sources, including Hive, Avro, Parquet, ORC, JSON, and JDBC. You can even join data from different data sources.
Discretized Streams (Dstreams)
Spark supports two different ways of streaming: Discretized Streams (DStreams) and Structured Streaming. DStreams is the basic abstraction in Spark Streaming. It is a continuous sequence of RDDs representing a stream of data. Structured Streaming is the newer way of streaming built on the Spark SQL engine.
When you search for any example scripts about DStreams, you find sample codes that read data from TCP sockets. So I decided to write a different one: My sample code will read from files in a directory. The script will check the directory every second and process the new CSV files it finds. Here’s the code:
Here is the step-by-step explanation of the above script:
- Lines 1,4) I already explained this in previous code blocks.
- Line 2) For DStreams, I import the StreamingContext library.
- Line 5) I create a Streaming Context object. The second parameter indicated the interval (1 second) for processing streaming data.
- Line 7) Using textFileStream, I set the source directory for streaming, and create a DStream object.
- Line 8) This simple function parses the CSV file.
- Line 10) This is the action command for the DStream object. pprint method writes the content.
- Line 12) Starts the streaming process.
- Line 14) Waits until the script is terminated manually.
At every second, the script will check “/tmp/stream” folder, if it finds a new file, it will process the file and write the output. For example, if we put a file that contains the following data in the folder:
Fatih,5
Cenk,4
Ahmet,3
Arda,1
The script will print:
-------------------------------------------
Time: 2023-02-16 13:31:53
-------------------------------------------
['Fatih', '5']
['Cenk', '4']
['Ahmet', '3']
['Arda', '1']
pprint is a perfect function to debug your code, but you probably want to store the streaming data to an external target (such as a Database or HDFS location). DStream object’s foreachRDD method can be used for it. Here’s another code to save the streaming data to JSON files:
Here is the step-by-step explanation of the above script:
- Lines 1,5,6,19,21) I already explained them in previous code blocks.
- Line 2) Because I’ll use DataFrames, I also import the SparkSession library.
- Line 3) For DStreams, I import the StreamingContext library.
- Line 7) I create a Streaming Context object. The second parameter indicated the interval (1 second) for processing streaming data.
- Line 9) Using textFileStream, I set the source directory for streaming and created a DStream object.
- Line 10) This simple function parses the CSV file.
- Line 12) I define a function accepting an RDD as parameter.
- Line 13) This function will be called every second – even if there’s no streaming data, so I check if the RDD is not empty
- Line 14) Convert the RDD to a DataFrame with columns “name” and “score”.
- Line 15) Write the data to the points_json folder as JSON files.
- Line 17) Assign the saveresult function for processing streaming data
After storing all these data in JSON format, we can run a simple script to query data:
Structured Streaming
Structured Streaming is a stream processing engine built on the Spark SQL engine. It supports File and Kafka sources for production; Socket and Rate sources for testing. Here is a very simple example to demonstrate how structured streams work:
Here is the step-by-step explanation of the above script:
- Lines 1-5) I already explained them in previous code blocks.
- Line 7) I create a DataFrame to process streaming data.
- Line 8) It will read CSV files in the path (/tmp/stream/), and the CSV files will contain the name (string) and points (int) data. By default, Structured Streaming from file-based sources requires you to specify the schema, rather than rely on Spark to infer it automatically.
- Line 9) The data will be grouped based on the “name” column, and aggregate points.
- Line 10) The data will be ordered based on points (descending)
- Line 12) The output will be written to the console and the application will wait for termination.
For testing, I created 2 CSV files:
1.csv:
Fatih,5
Cenk,4
Ahmet,3
Arda,1
2.csv:
Fatih,1
Cenk,1
Ahmet,2
Osman,1
David,2
Then I started the script, and on another terminal, I copied the above files one by one to /tmp/stream/ directory (if you don’t have the directory, you should create it):
cp 1.csv /tmp/stream
cp 2.csv /tmp/stream
Here is the output of the PySpark script:
-------------------------------------------
Batch: 0
-------------------------------------------
+-----+-----------+
| name|sum(points)|
+-----+-----------+
|Fatih|          5|
| Cenk|          4|
|Ahmet|          3|
| Arda|          1|
+-----+-----------+

-------------------------------------------
Batch: 1
-------------------------------------------
+-----+-----------+
| name|sum(points)|
+-----+-----------+
|Fatih|          6|
| Cenk|          5|
|Ahmet|          5|
|David|          2|
| Arda|          1|
|Osman|          1|
+-----+-----------+
Although I also talked about GraphFrames and Spark’s Machine Learning capabilities in my presentation, I will not include examples of them in this blog post. I hope this blog post will be helpful.